Whenever we execute a procedure, it’s out of our hands. We expect it to do what it was designed to do, but what if it doesn’t? What if it takes a lot more time then expected? All kind of questions start to arise:
- Is it almost finished, should I wait just a few more minutes?
- Is it trapped in an infinitive loop? Or are my queries running slow?
- Can I safely kill it? Or did it already commit some changes and should I reverse them?
- Which job should I kill, is this mine?
We want some kind of feedback from our program, but since programs just do what we ask them to do, it’s up to us to find a way of getting the information we need. So how can you instrument your code? It’s not that difficult, you just have to add some lines of codes that tell you what it’s doing. When developing a procedure, and it’s not immediately doing what you expect, you might add some lines of code using DBMS_OUTPUT. That’s code instrumentation, by adding this you’re able to locate the problem and correct it. But DBMS_OUTPUT is very limited and you should create, or find, a proper logging mechanism. You really should! But the aim of this article is to show you what’s already present in the database and how we can get the most out of it.
Setting your identifier
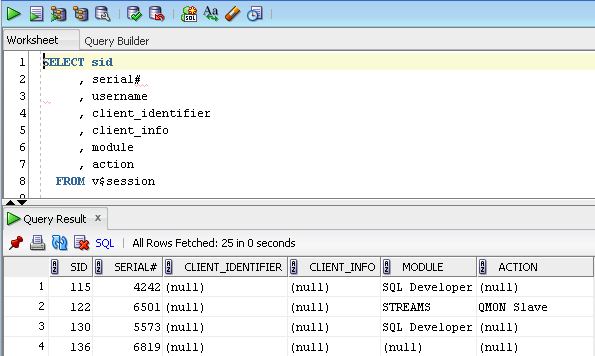
Luckily for us, Oracle has already put a lot of effort in instrumenting the database. When you need an answer to the question: “Which session do I need to kill?” you can query the performance view “V$SESSION”, and most of the time you’ll able to pinpoint the badly behaving session. It shows you what it’s doing, which SQL-statement it last executed, or what it is waiting for. But when looking at the data in V$SESSION, you also see a lot of empty fields like client_identifier, client_info, module and action.
These fields are free for you to use. If your DBA will allow grants on DBMS_SESSION and DBMS_APPLICATION_INFO you will be able to monitor your programs easily with the V$SESSION view:
|
1 2 3 4 5 6 7 8 9 10 11 12 |
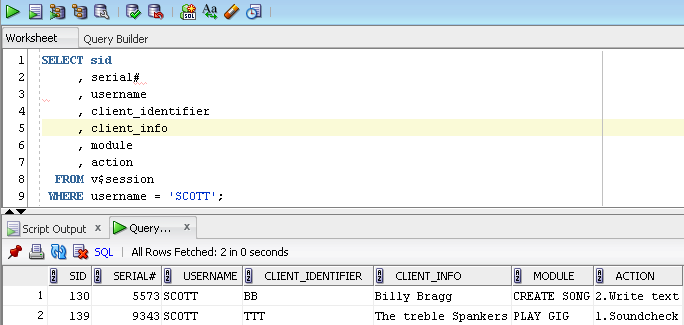
BEGIN dbms_session.set_identifier(client_id=>'BB'); dbms_application_info.set_client_info(client_info=>'Billy Bragg') -- dbms_application_info.set_module(module_name=>'CREATE SONG', action_name=>'1.Write Melody'); write_melody; -- dbms_application_info.set_action(action_name=>'2.Write text'); write_text; --... dbms_application_info.set_module(module_name=>'',action_name=>''); END; |
Querying the V$SESSION view again, it will provide you with much more detailed information. Your DBA would love you for this!
Tracing
Setting these identifiers makes enabling tracing these programs a breeze. Using DBMS_MONITOR you can trace a session by using SESSION_TRACE_ENABLE and specifying a sessions SID and serial number. However, it might by more useful not to trace a single session, but to trace a single module or action:
|
1 2 3 4 5 6 7 |
BEGIN dbms_monitor.serv_mod_act_trace_enable(service_name => 'SYS$USERS' ,module_name => 'PLAY GIG' ,waits => TRUE ,binds => TRUE ,instance_name => NULL); END; |
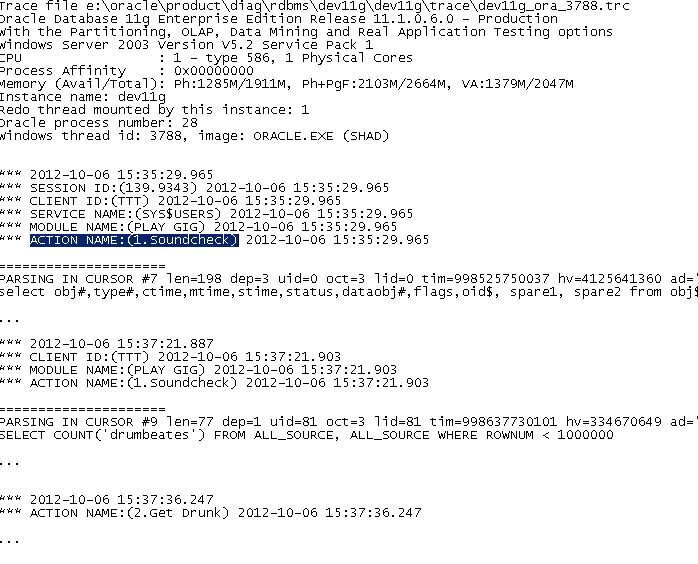
Now you can take a look at the trace files. Most of us have heard of TKPROF, a little command line tool that comes with the database. Have you also heard of TRCSESS? Ever wondered what all those extra parameters in TRCSESS mean? TRCSESS is another little command line tool allowing you to take the input from one or more trace files and apply filters to get the set of SQL statements you’re interested in. Since these trace files also contain the module and action information you can easily create a trace file for the part that needs some investigation. In the raw data you can find the different actions in your module:
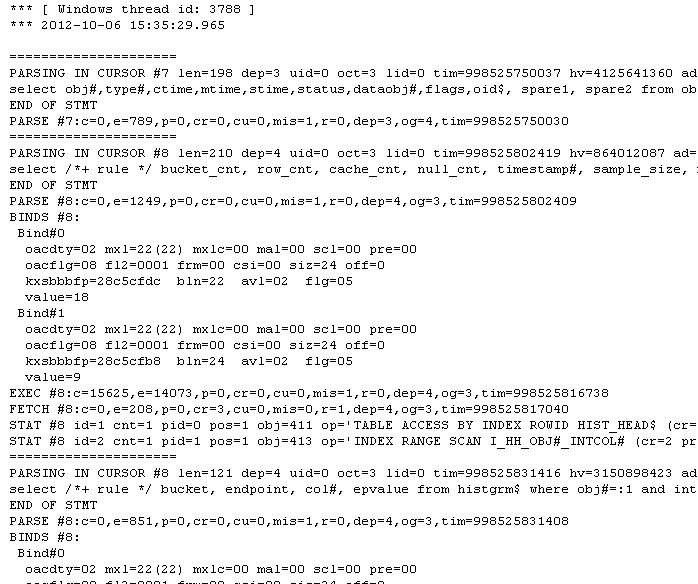
After filtering it for only one action, you have removed the statements that don’t belong to this criterion:
|
1 |
trcsess output=mytrace.trc action="1.Soundcheck" dev11g_ora_3788.trc |
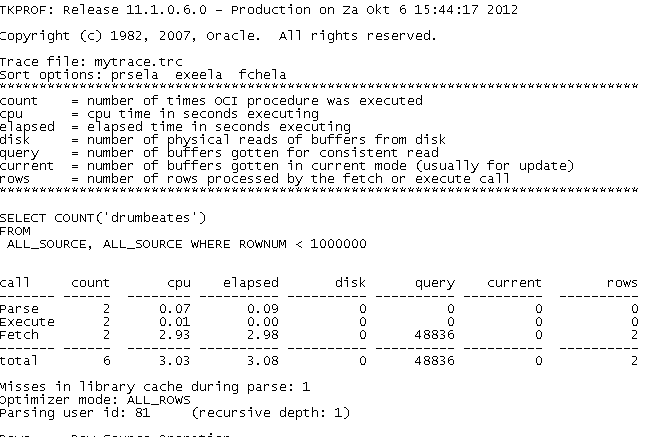
This allows you to create a report using TKPROF which contains only the statements you’re interested in. This makies it easier to tune your applications.
|
1 |
tkprof mytrace.trc mytrace.txt sys=no sort=prsela,exeela,fchela |
Enterprise Manager
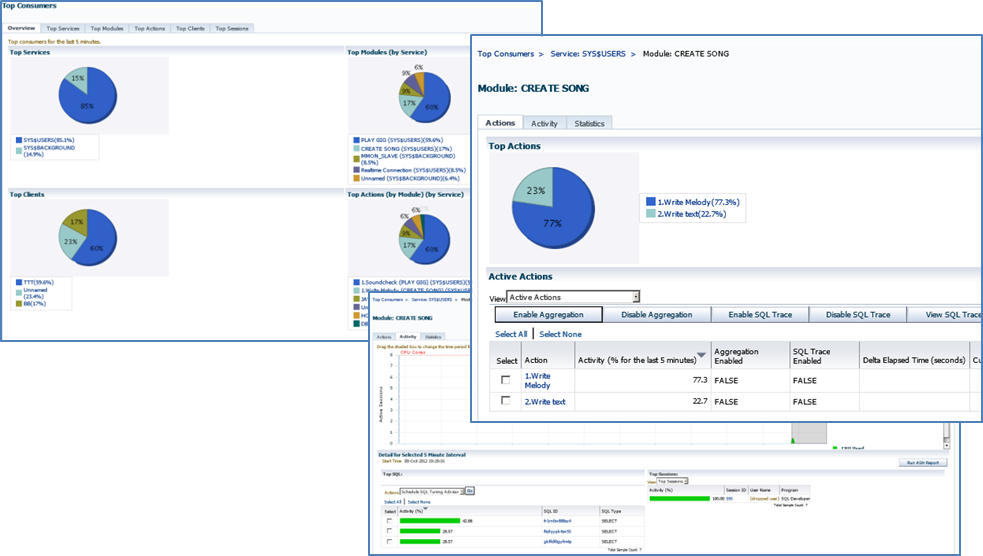
What can be found in the performance views, can also be found in Enterprise Manager. Filter, aggregate, drill down and get all information you want with some simple clicks.
Summary
As you can see you can add some lines of code to set your identifier, module and action. It won’t take much time to implement but it will optimize the traceability of your programs. It might be a lifesaver when things go wrong.
Load comments